CRAN
24 July, 2026
Preview
Total CRAN downloads for all packages:
cran %>% dplyr::summarize(download_total = sum(count))## # A tibble: 1 × 1
## download_total
## <dbl>
## 1 30074CRAN package downloads over time, summarized by month.
cran_stats <- cran %>%
  separate(date, into=c("year", "month name", "day"), sep = "-") %>%
  unite("Month", c("year", "month name"), sep='-', remove=TRUE) %>%
  group_by(Month, package) %>%
  summarise(monthly_downloads = sum(count)) %>% #summarize monthly downloads by package
  filter(monthly_downloads > 0) #drop the 0's

ggplot(cran_stats, aes(Month, monthly_downloads, group=package, color = package)) +
  geom_line() +
  geom_point() +
  theme(panel.background = element_blank(), panel.grid = element_blank()) +
  theme(axis.text.x = element_text(angle = 90)) +
  labs(x = NULL,
       y = "Monthly Downloads",
       color = "R Packages")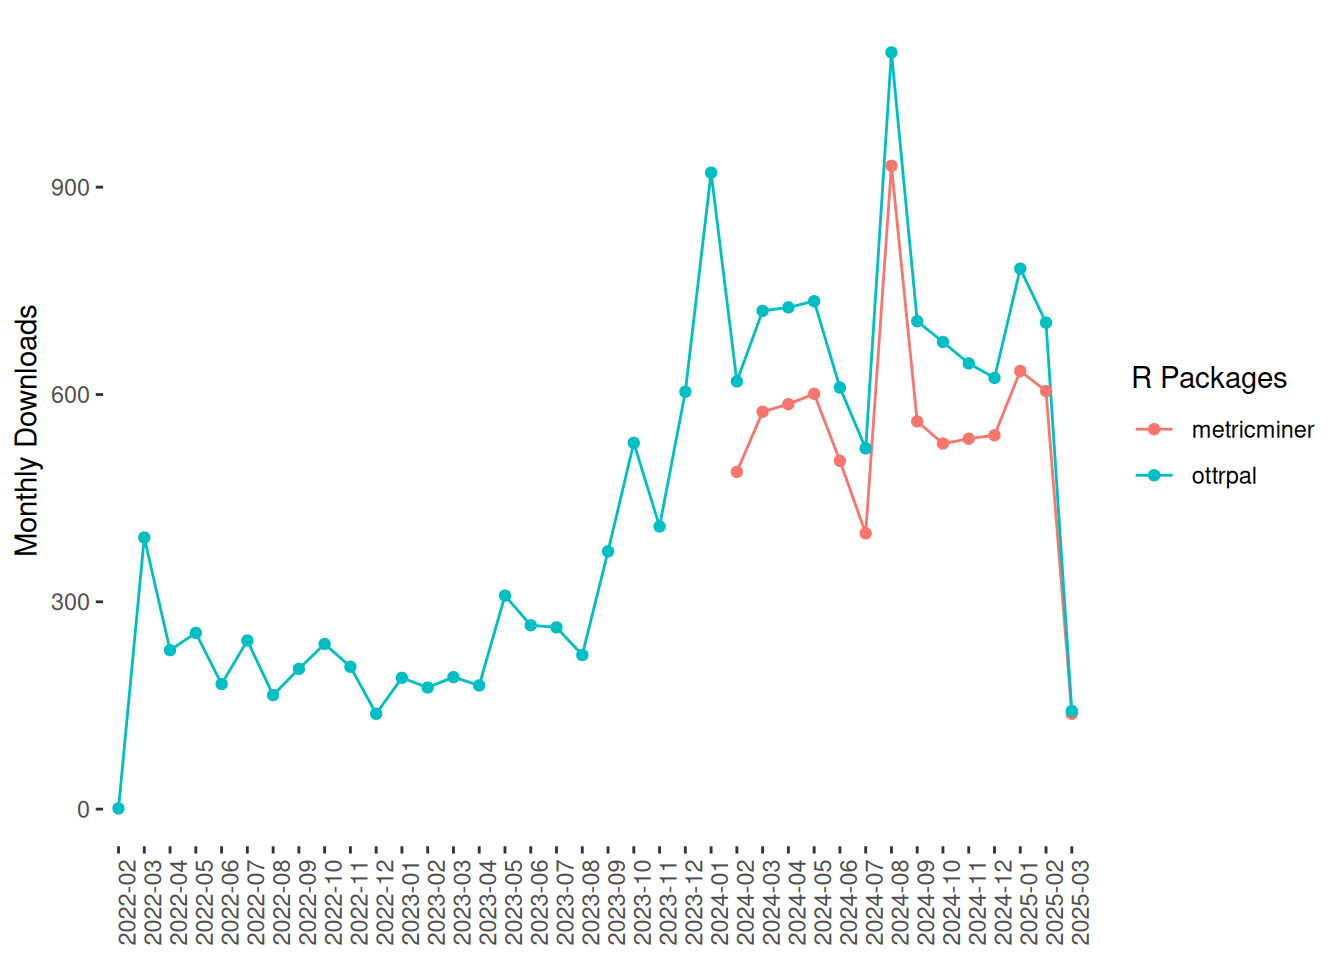
Setting up CRAN
In the _config_automation.yml file you will need to
specify the CRAN packages that you would like metricminer to collect
data from.
###### CRAN ######
refresh-cran: yes
cran_packages: [ metricminer, ottrpal ]
cran_googlesheet:
In the
_config_automation.ymlfile, make sure thatrefresh-cranis set to “yes”.In
cran_packages, type the names of the packages that you’d like to collect data from on CRAN. Type them exactly as they are spelled, case sensitive, separated by commas. Delete the example package names we’ve put there.Optionally, if you are saving data to Google, specify a googlesheet ID in
cran_googlesheetwhere you’d like the CRAN data to be saved. This will only be relevant if you’ve setdata_desttogoogle.
Customizing CRAN Data
In order to customize the data you are downloading from CRAN you can
modify the refresh-scripts/refresh-cran.R script in your
repository.
You can take a look at the metricminer
R package documentation for more details about the functions and
what is possible.
If you have a metric need that is not currently fulfilled by
metricminer or metricminer-dashboard we
encourage you to file a
GitHub issue with us and let us know about your new feature idea (or bug
report).